
News From The River
See the Latest Water Quality Monitoring Data from the FoRR Monitoring Team!
FoRR took to the river on October 17 to monitor three sites in the Reedy River watershed. Our sites include the following:
Site #1: Reedy River just downstream of Swamp Rabbit Cafe
Site #2: A small tributary of the Reedy River in Falls Park
Sit #3: Reedy River on Mauldin Road upstream of ReWa's headquarters
The pH results for October were consistent with our findings in September, with only one site showing a small shift from September’s results.
The air and water temperatures for October’s sampling event dropped drastically from the temperatures in September. The average air temperature decreased by 13.7°C and the average water temperature decreased by 9.3°C . The air temperatures ranged from 11°C at both Mauldin Road and Falls Park to 15°C at Swamp Rabbit Café, the last site we sample during each monitoring outing. The water temperature was 13°C at all three sites.
October’s dissolved oxygen (DO) results varied minimally from September’s, despite the lower water temperatures. We can assume that though the water temperatures were much lower at the time of sampling, they had not been low for long enough to further raise DO levels, especially given the drastic and sudden temperature shift from September to October. The DO at the sites on the Reedy at Mauldin Road and near Swamp Rabbit Café both increased slightly, with the 0.9 mg/L increase at Mauldin Road marking the greatest change from last month’s results, while the Falls Park levels dropped slightly (only by 0.2 mg/L) from 6.8 mg/L to 6.6 mg/L. The average DO level across all sites was 7.38, which is typical for what we find this time of year, though we will likely see the levels increase as cool temperatures become more consistent.
The E. coli bacteria results from October’s monitoring event decreased to very low levels at the Mauldin Road and Falls Park sites, but increased significantly at the location near Swamp Rabbit Café. Mauldin Road decreased by 100 CFU/100mL for a low level of only 133 CFU/100mL and Falls Park dropped by 66 CFU/100mL to 267 CFU/100mL. While we are pleased with these results, the sudden and unusual increase in E. coli coliform forming units at the Swamp Rabbit Café site are troubling, especially when paired with the high turbidity levels as explained below. The site near Swamp Rabbit Café had much higher results than we typically see at this location and increased 566 CFU/100mL from last month, coming in at 733 CFU/100mL. While 733 CFU/100mL is still below the “problematic” threshold of 1,000 CFU/100mL, it is closer than we would like and warranted some additional investigating, especially given high turbidity levels at the site.
While October’s turbidity results were once again a consistent level of 5 NTUs at both Mauldin Road and Falls Park, the same levels we have read since June 2023, the turbidity at Swamp Rabbit Café was significantly higher at 19 NTUs. Even before sampling, we could tell the turbidity would be high. When our volunteer stepped into the shallow water near the bank to sample, their boot wasn’t even visible through the cloudy water and it was nearly impossible to see the rocks we are familiar with seeing in the river. Immediately upon arrival, we could tell that something was awry.
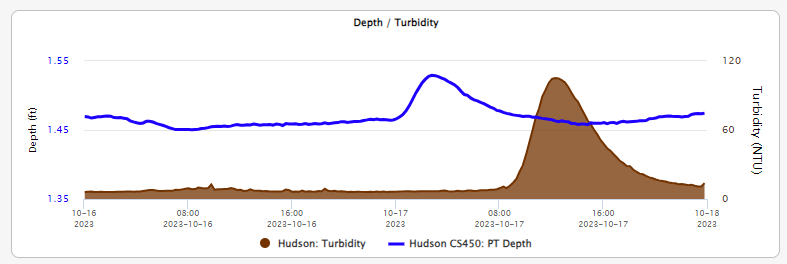
The high turbidity levels at our Swamp Rabbit Café site combined with the high E. coli bacterial presence at the same location prompted us to contact the Greenville County Soil and Water Conservation District and the City of Greenville Engineering Department about these findings. Our initial assumption was that upstream construction activity or land disturbance could have resulted in an illicit discharge, but fortunately this possibility was ruled out through investigation by Greenville County. The graph below shows the relationship between water height and turbidity at a nearby Greenville County continuous stream monitoring station, which was provided to us by the City of Greenville Engineering Department. There appears to have been a rapid increase in flow in the early morning hours on October 17, followed by high turbidity a while later (at the time of our sampling at 11am). A likely theory is that there could have been a water main break somewhere upstream overnight and then the repairs to the system during the later morning caused sediment in or near the stream to be heavily disturbed, resulting in high turbidity downstream. Please note this is only a theory and has not been confirmed at this time. Though the exchange of emails, photos, and site visits by both the County and City did not produce a definitive reason for the high turbidity and E. coli levels, we did confirm that the issue was not ongoing and was likely a one-time occurrence and sincerely appreciate Greenville County and the City of Greenville for their help in this evaluation.
October’s results and the SC state standards are included for comparison below. All results were within SC state standards.
October 2023 Monitoring Results:

|